TagPulse Hands-On Review - AI-Driven Windows System Monitoring Reimagined
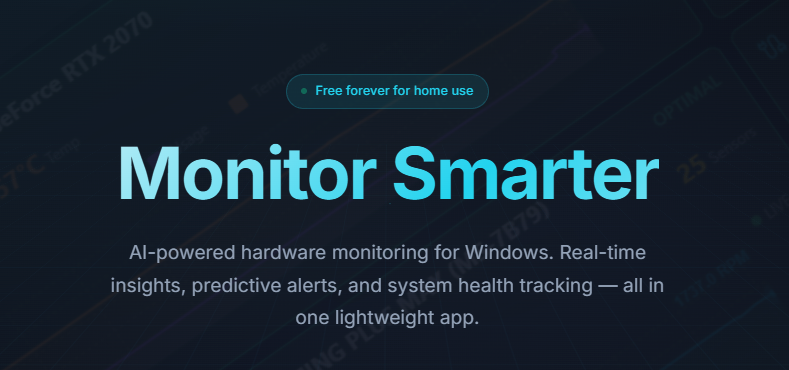
Welcome to our comprehensive TagPulse review — an AI-powered system monitoring tool built natively for Windows.
Why Traditional System Monitors Fall Short
Most hardware monitoring tools share the same frustrating limitations. They either bombard you with impenetrable dashboards full of technical data you don't need, or they only raise alarms after something has already gone wrong. Common pain points include:
- Reactive alerts that fire when thresholds are crossed — not before problems develop
- Heavy resource consumption — monitoring tools that slow down the system they're supposed to protect
- Information overload — endless metrics with no guidance on what actually matters
- Silent disk degradation — SMART data reveals warning signs months before failure, but most tools bury this information
- No centralized fleet view — IT teams managing dozens of Windows machines lack unified visibility without costly enterprise solutions
TagPulse was designed to address every one of these problems.
What Makes TagPulse Different
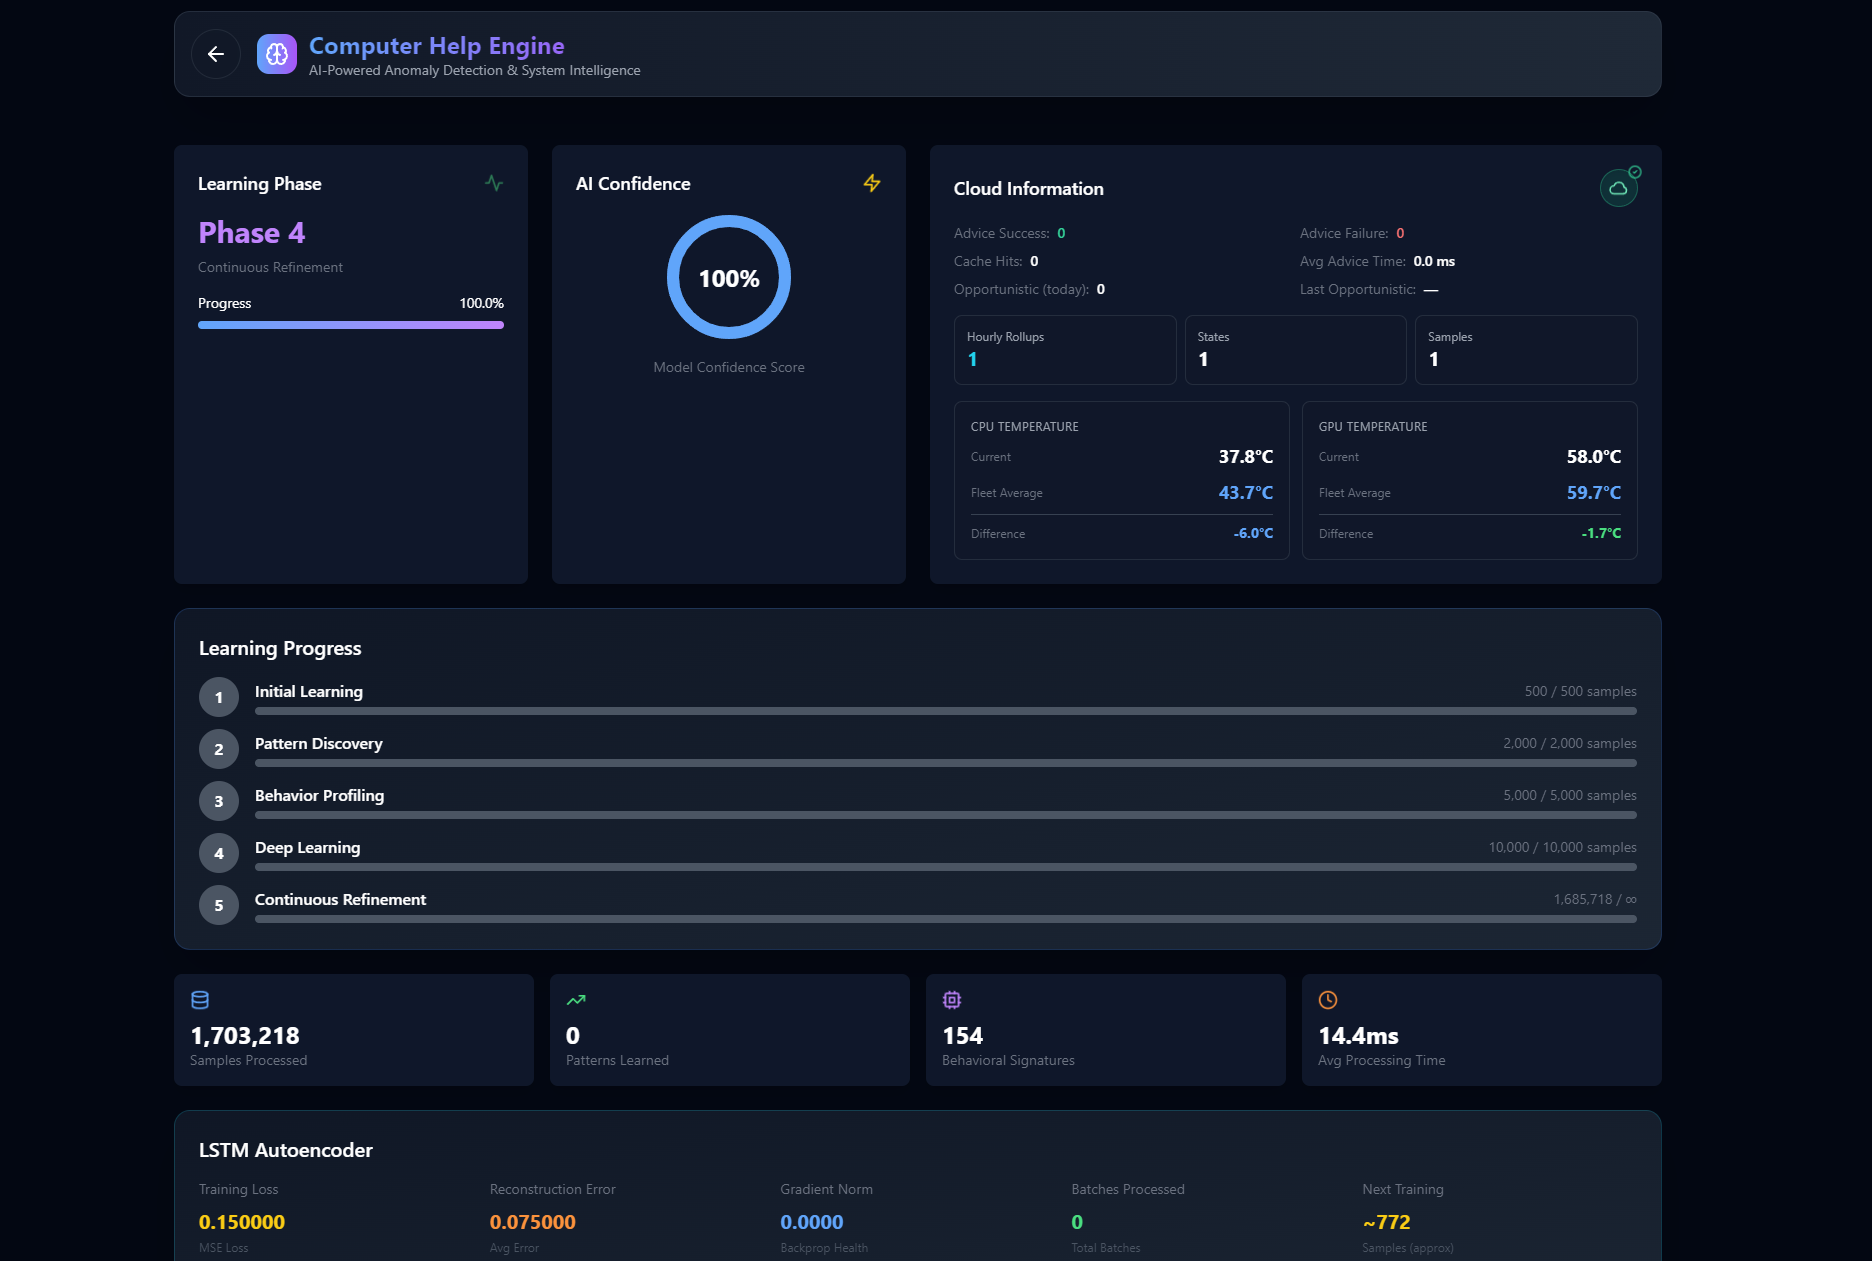
At its core sits the CHE (Computer Help Engine) — an AI that observes your system's behavior patterns and predicts potential failures before they materialize. It's like having a smart IT technician monitoring your PC around the clock.
Key differentiators at a glance:
- CHE learns your specific system's normal behavior and flags anomalies, not just fixed thresholds
- Real-time tracking covers CPU, GPU, RAM, disk usage, network activity, and temperatures with live-updating graphs
- SMART disk health analysis reads and interprets all SMART attributes for early failure detection
- Predictive alerts warn of temperature spikes and hardware degradation before they become critical
- Resource footprint stays under 2% CPU and approximately 100MB RAM — genuinely lightweight
- Performance history lets you review trends over days, weeks, or months
- Built exclusively for Windows 10 and Windows 11
- Free forever for home use, no credit card required
- Fleet management offers affordable centralized monitoring for businesses and IT teams
Deep Dive: The CHE AI Engine
How It Learns
The Computer Help Engine operates in three phases:
- Collection — Continuous real-time data streams from CPU, GPU, RAM, disks, and thermal sensors
- Analysis — The AI establishes your system's unique baseline by learning usage patterns over time
- Protection — Smart alerts trigger when anomalies are detected, well before they escalate into failures
Why Learning Matters
Fixed-threshold monitoring treats every system identically. CHE recognizes that a gaming rig under load behaves differently from an office workstation — and adjusts its expectations accordingly. It detects unusual behavior patterns, grows smarter with more data, and delivers predictive warnings rather than reactive notifications. During our testing, CHE caught temperature spikes hours before they would have caused thermal throttling during extended gaming sessions.
Hardware Monitoring Breakdown
CPU and GPU
Processor tracking goes well beyond percentage readouts:
- Instantaneous utilization updates for both CPU and GPU
- Continuous thermal monitoring to catch overheating early
- Per-core analysis showing individual core performance
- Live trend graphs visualizing performance over time
This level of detail is essential for gamers, video editors, 3D renderers, and anyone overclocking their hardware.
RAM and Storage
Memory and disk monitoring covers:
- Which applications are consuming your RAM at any given moment
- Real-time read/write activity on all drives
- Available space and overall storage performance
- Identification of resource bottlenecks holding your system back
Network Activity
Bandwidth tracking shows real-time upload and download speeds, connection stability, and which applications are consuming the most network resources.
SMART Disk Health: Preventing Data Loss
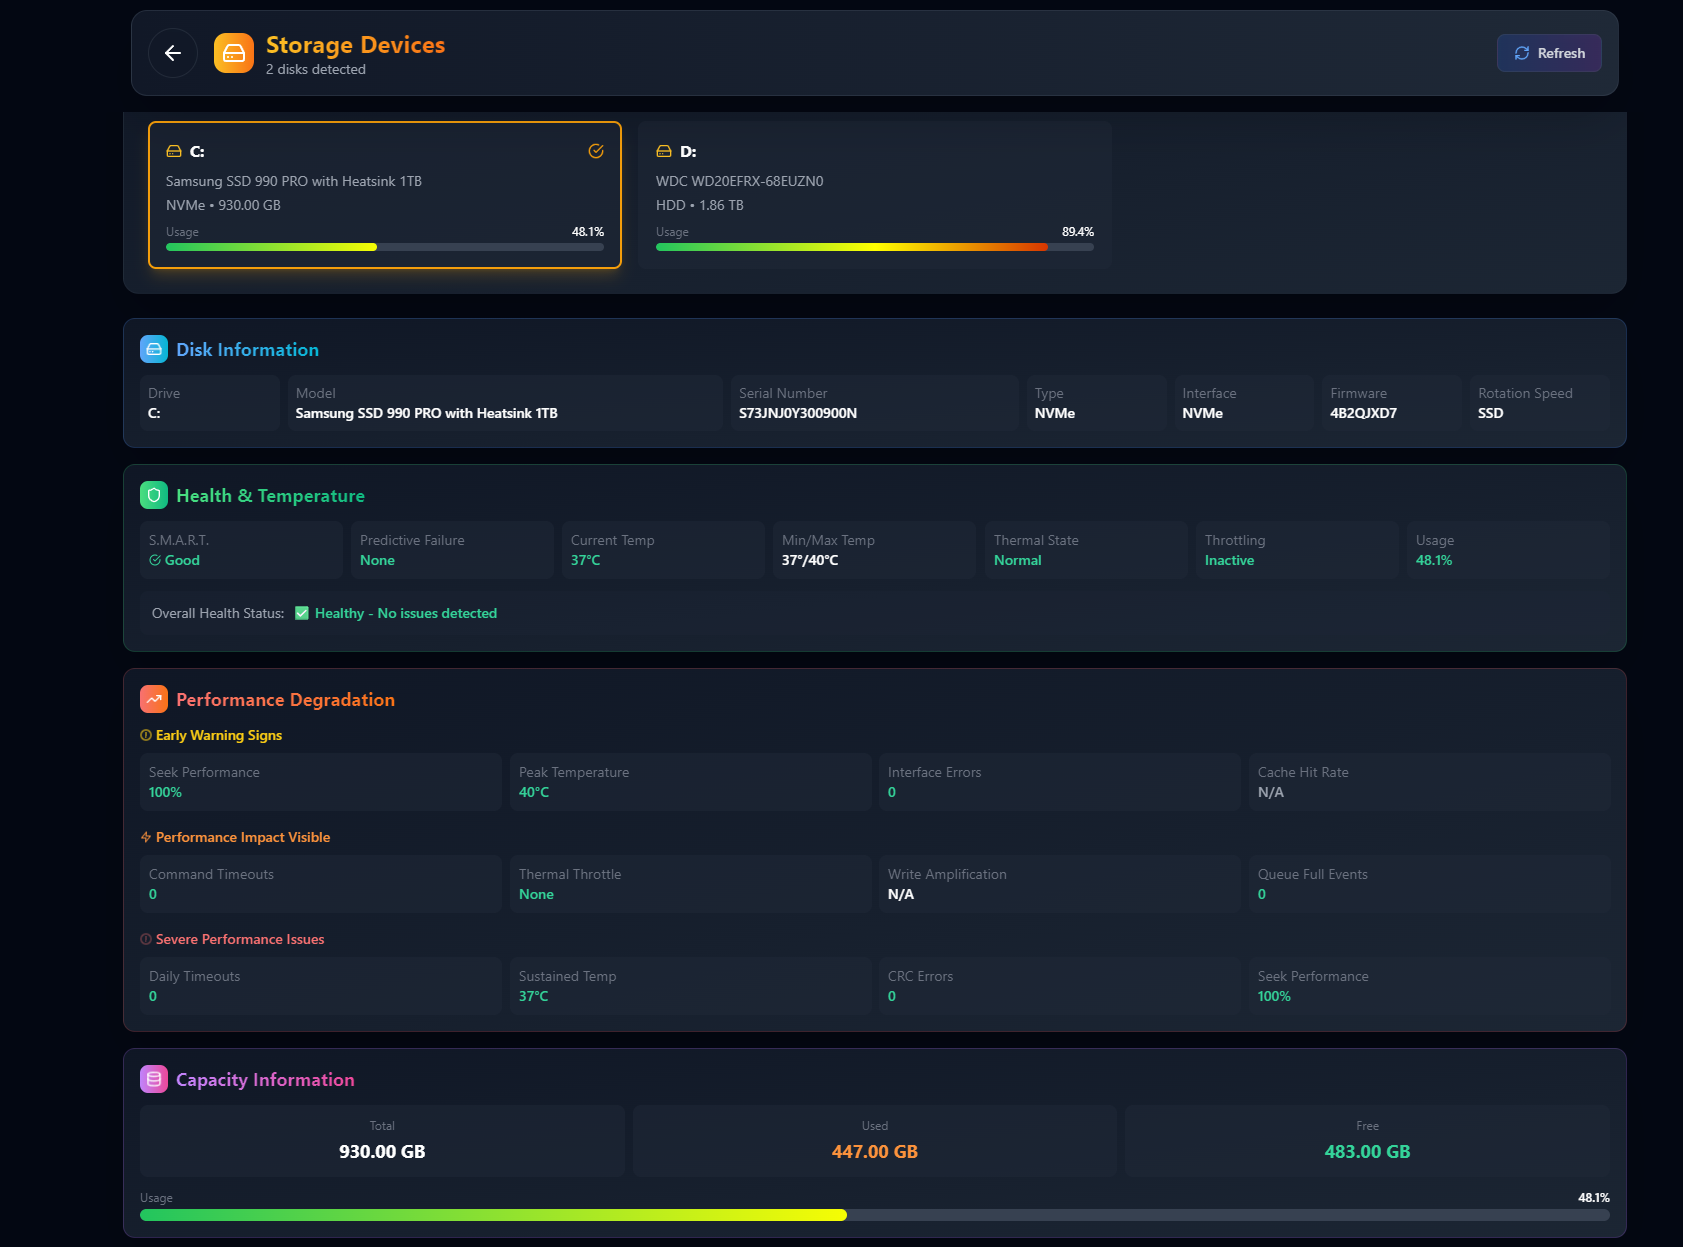
Hard drives almost always show warning signs through SMART (Self-Monitoring, Analysis and Reporting Technology) data months before catastrophic failure. TagPulse surfaces this information in a way that's actually usable:
- Complete monitoring of all SMART attributes across every drive
- Continuous drive temperature tracking
- Early degradation warnings that give you time to back up and replace
- AI-powered predictive analysis estimating potential failure timelines
TagPulse strikes the right balance — making SMART data understandable without hiding critical details behind technical jargon. It prioritizes the attributes that genuinely predict failure and delivers clear, actionable warnings.
Software Impact Analysis
Understanding which programs are dragging down performance is crucial for optimization. TagPulse breaks down:
- Resource consumption per application — CPU, RAM, and disk
- Overall performance impact of each running program
- Background processes silently consuming resources
- Clear guidance on which applications to close or upgrade
This feature is particularly useful for identifying resource conflicts and fine-tuning your workflow.
Real-World Performance Observations
During extended testing across gaming sessions and video rendering workloads, TagPulse delivered:
- Predictive accuracy: CHE detected potential overheating roughly 3-4 hours before problems would manifest
- CPU efficiency: Averaged just 1.2% utilization, comfortably under the claimed 2% ceiling
- Memory efficiency: Consistently hovered around 95MB, confirming the ~100MB specification
- Alert speed: Temperature warnings triggered within seconds of threshold breaches
- Data reliability: SMART disk analysis results matched professional-grade diagnostic tools
- Interface responsiveness: Dashboard updates remained fluid even under heavy system load
The combination of accurate telemetry and near-zero performance impact makes TagPulse suitable for always-on monitoring without hesitation.
Interface and Usability
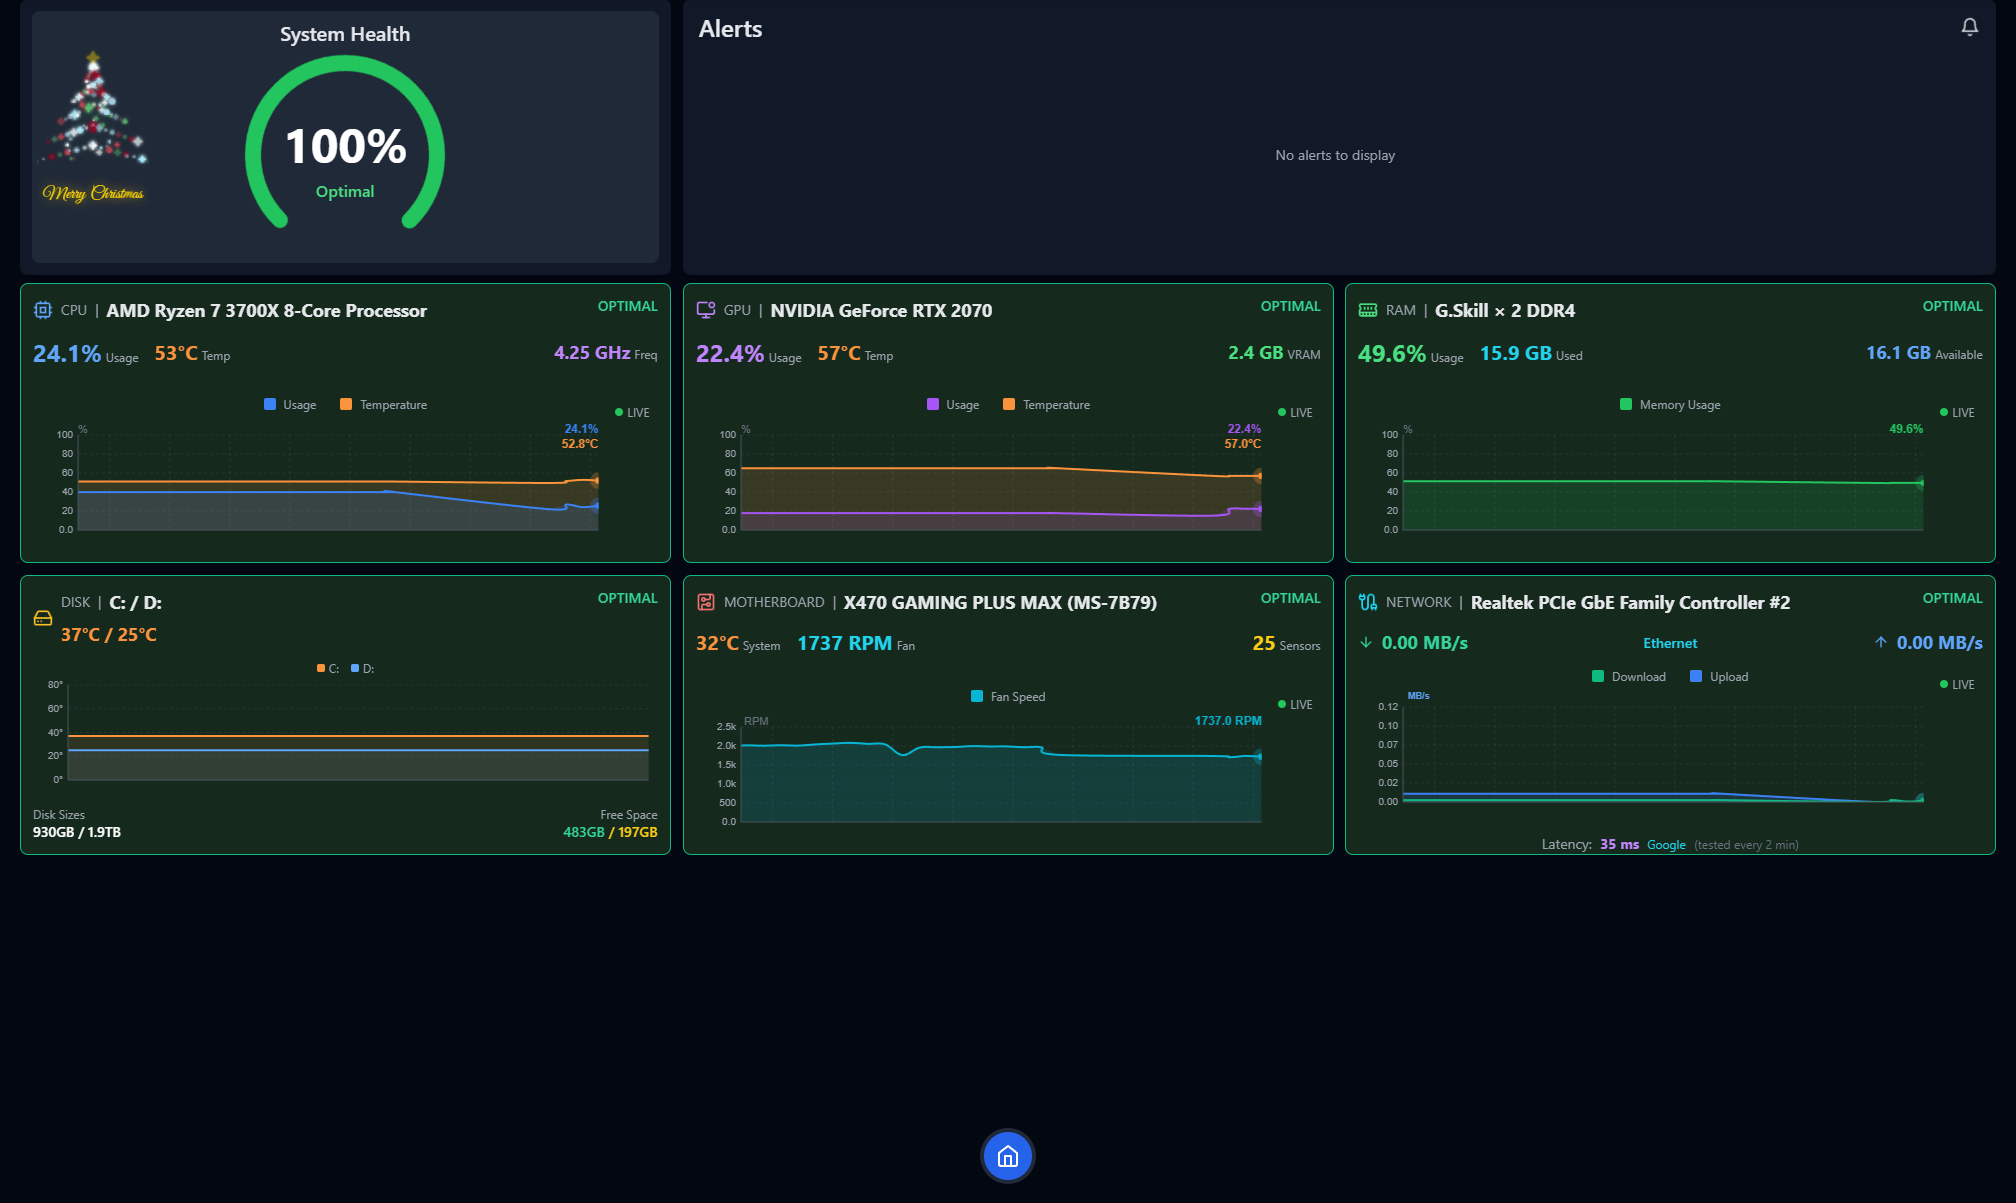
The dashboard presents a clean, at-a-glance overview of CPU, GPU, RAM metrics alongside temperature readouts and network/disk activity visualizations. Information is organized logically rather than scattered across confusing panels. Graphs and charts are easy to interpret, and smooth animations enhance the experience without distracting from the data. Dark mode is supported for extended monitoring sessions.
Customization options include metric prioritization, adjustable alert thresholds, configurable dashboard layouts, and variable data refresh frequencies.
Pricing Structure
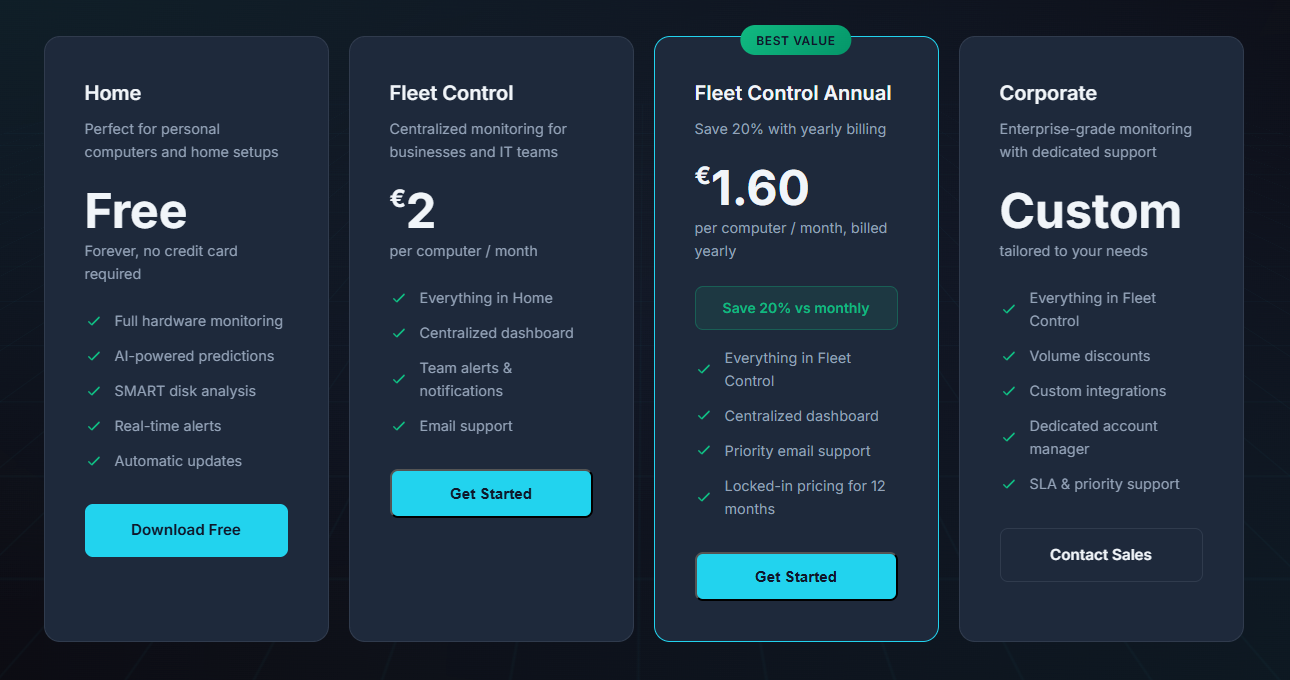
Home — Free Forever
Complete hardware monitoring with AI-powered CHE predictions, SMART disk analysis, real-time alerts, and automatic updates — all at zero cost with no credit card required. This is genuinely remarkable value; most competitors charge for basic features or severely restrict free tiers.
Fleet Control — €2/computer/month
Adds a centralized dashboard for all devices, team alerts and notifications, and email support. Designed for small to medium businesses needing fleet-wide visibility without enterprise complexity.
Fleet Control Annual — €1.60/computer/month
20% savings with yearly billing, plus priority email support and locked-in pricing for 12 months. The best value for organizations committed to long-term fleet monitoring.
Corporate — Custom Pricing
Volume discounts, custom integrations, dedicated account management, and SLA-backed priority support for large-scale enterprise deployments.
Competitive Landscape
| Feature | TagPulse | HWiNFO | HWMonitor | AIDA64 |
|---|---|---|---|---|
| Real-time sensor data | Yes | Yes | Yes | Yes |
| Temperature monitoring | Yes | Yes | Yes | Yes |
| SMART disk health | Yes | Yes | Yes | Yes |
| Detailed hardware info | Essential | Extensive | Basic | Extensive |
| AI-powered analysis | Yes | None | None | None |
| Predictive alerts | Yes | None | None | None |
| Fleet dashboard | Yes | None | Pro Only | Network Audit |
| Cloud sync | Yes | None | None | None |
| Windows Event analysis | Yes | None | None | None |
| Pricing | Free / Fleet | Free | Free / Pro | Paid Only |
TagPulse's AI learns your specific hardware configuration rather than applying one-size-fits-all thresholds — fewer false alarms, more accurate warnings. Fleet management enables monitoring all computers from a single web dashboard. Predictive alerts identify degradation trends early, giving you time to act before downtime occurs. Windows Event analysis adds a layer of insight that hardware sensors alone cannot provide.
Who Should Use TagPulse
- Gamers who need temperature and resource monitoring during intense sessions to prevent thermal throttling
- Content creators — video editors, 3D artists, streamers — pushing systems under sustained workloads
- Power users seeking deep visibility into system performance and health
- IT teams managing multiple Windows devices who need centralized, proactive monitoring
- MSPs servicing client computers at scale with centralized oversight
- Businesses with Windows fleets requiring enterprise-grade monitoring without enterprise pricing
- Home users who get professional-grade monitoring completely free
Setup and Requirements
TagPulse is designed exclusively for Windows 10 and Windows 11 on 64-bit systems. Hardware requirements are minimal — it runs on virtually any modern Windows PC. Administrator rights are recommended for full hardware monitoring including temperature sensors, and a network connection is required for AI features and updates.
Installation takes under five minutes: download the installer from the official site, run it, launch, and optionally customize alert thresholds and dashboard preferences. The installer auto-detects your system configuration and applies sensible defaults.
Final Verdict
After thorough testing across multiple system configurations and usage scenarios, TagPulse delivers on its promises. The AI-powered predictive monitoring genuinely transforms how you understand and protect a Windows machine. What stood out most was the combination of sophisticated AI technology with an interface that remains accessible to non-technical users.
The CHE engine's ability to learn system behavior and predict issues is genuinely innovative, and it accomplishes this while staying lightweight enough for continuous background operation. The free forever plan makes professional-grade monitoring accessible to everyone — a rarity in this space. Business and enterprise tiers offer excellent value for organizations managing multiple Windows systems.
Ratings
- Ease of Implementation: 5/5
- Feature Set: 5/5
- Performance Impact: 5/5
- Value for Money: 5/5
- Innovation: 5/5
- User Experience: 5/5
- Overall Score: 5/5
Ready to monitor smarter? Download TagPulse for Windows and experience AI-powered system monitoring that learns your PC and helps prevent problems before they happen.
Tags
# Review# TagPulse# Real-Time System Monitoring# AI Predictive Alerts# SMART Disk Health Analysis# Hardware monitoring# System performance# CPU monitoring# GPU tracking# RAM usage# Disk health# Windows monitoring tool# AI system optimization# Predictive maintenance# System health tracking# Temperature monitoring# Network activity# Performance analysis# Computer Help Engine# CHE technology# System resource monitoring# Windows 10 monitoring# Windows 11 monitoring# Fleet management# Business IT monitoring# Gaming performance# Creator tools# Lightweight monitoring# System alerts# Hardware failure prediction# SMART data analysis# Performance history# System trendsTickTappy Review - The Minimalist One-Tap Time Tracker That Just Works
Jam SQL Studio Comprehensive Review - The AI-Native SQL IDE for Every Desktop Platform
Follow for new blogs
Subscribe to our blog
Subscribe to Newsletter
Subscribe to our newsletter to get the best products weekly.